Querying Recorded Metrics
Navigate to http://<machine-ip>:9090/ to verify that you can query the recorded result of the rule, and that it looks correct.
First, query the recording rule's input expression:
sum without(status, instance) (
  rate(demo_api_request_duration_seconds_count{job="demo"}[5m])
)
Add a second query panel and query the recording rule's output metric name:
path_method:demo_api_request_duration_seconds_count:rate5m{job="demo"}Verify that the two queries return (roughly) the same result:
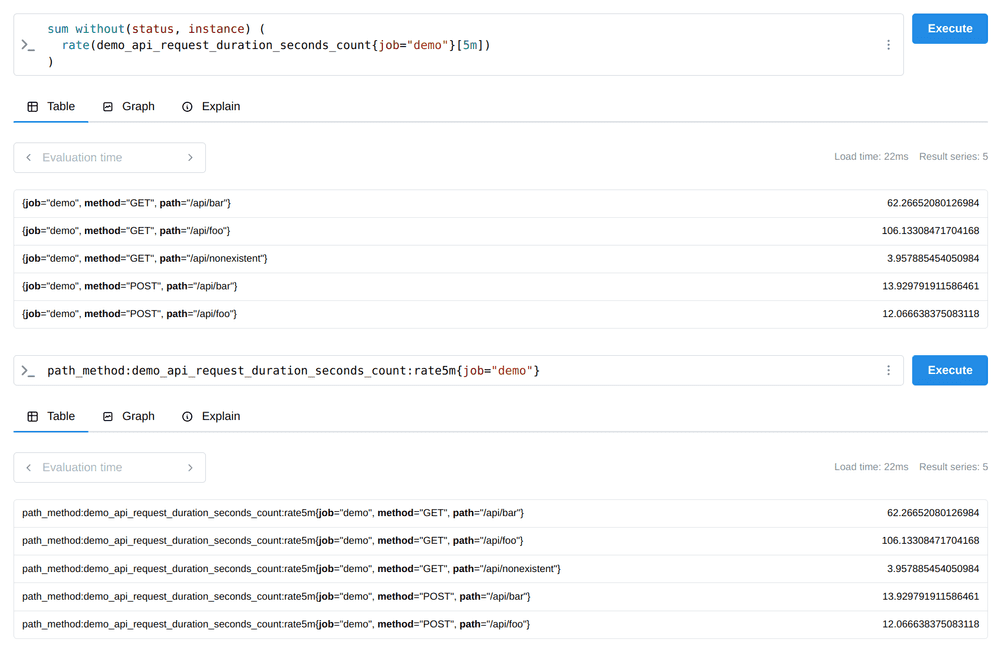
Note that the results will not look 100% identical, due to slight differences in evaluation timestamps. However, the results should look very similar and should be functionally equivalent.