Overview
At rare times, you may want to dive deeper into the execution details of the Prometheus or Alertmanager server binaries. This may be because you want to track down memory leaks, stuck goroutines, or other detailed performance issues and bugs inside the servers themselves. The Prometheus server and the Alertmanager are both written in Go and expose detailed Go-level profiling endpoints over HTTP on the /debug/pprof path. These endpoints allow you to track a variety of run-time information with minimal overhead:
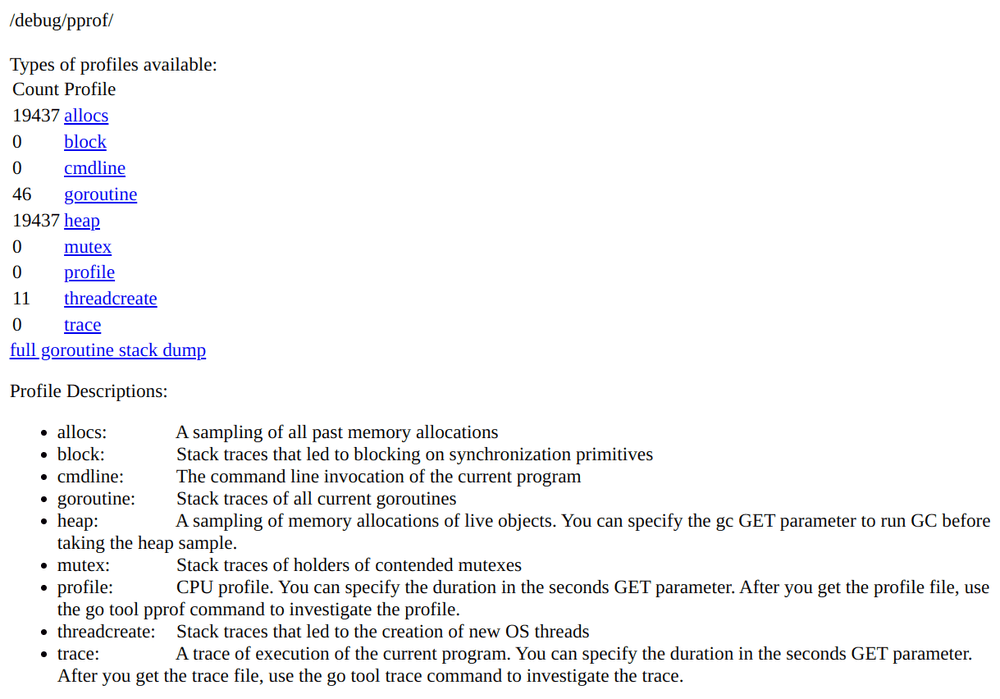
Among other information, the profiling endpoints allow you to fetch:
- Information on how the program is spending its CPU time (
/debug/pprof/profile), - Information on current heap memory usage (
/debug/pprof/heap), - Information on the execution state of all goroutines (Go-level "threads"), and whether they are currently blocked on something (
/debug/pprof/goroutine).
This profiling information is generally cheap to produce even for high-load production servers, so you don't need to worry about disrupting your setup when fetching profiling information. There are even services like Polar Signals and their open-source project Parca that allow you to fetch and record profiling information on a continuous basis, just like you would continuously monitor metrics. This then allows you to spot performance differences, regressions, and memory leaks, over time.
In the following sections, we will explore how to use both the web browser and the Go command-line tool to fetch, visualize, and interpret this profiling information.