Profiling CPU Usage
Prometheus' CPU profiling endpoint is available at /debug/pprof/profile – however, this endpoint delivers a binary format that cannot be consumed directly from a web browser. Instead, you will want to use the Go command-line tool to access it and fetch a current CPU profile.
For a Prometheus server running on localhost, you could fetch a CPU profile like this:
go tool pprof http://localhost:9090/debug/pprof/profileWithout specifying further flags, this will cause the Prometheus server to collect a CPU profile about itself over a period of 30 seconds. During that period, the in-process profiler inspects the call stack of all currently running goroutines multiple times a second and observes which functions they are currently executing. It then assembles statistics from those observations over the entire 30-second period that allow you to determine where the process spends the most CPU time overall.
Once the profiling completes, the Go tool opens the profiling shell again:
Fetching profile over HTTP from http://localhost:9090/debug/pprof/profile
Saved profile in /home/julius/pprof/pprof.prometheus.samples.cpu.001.pb.gz
File: prometheus
Type: cpu
Time: Aug 23, 2022 at 3:41pm (CEST)
Duration: 30s, Total samples = 90ms ( 0.3%)
Entering interactive mode (type "help" for commands, "o" for options)
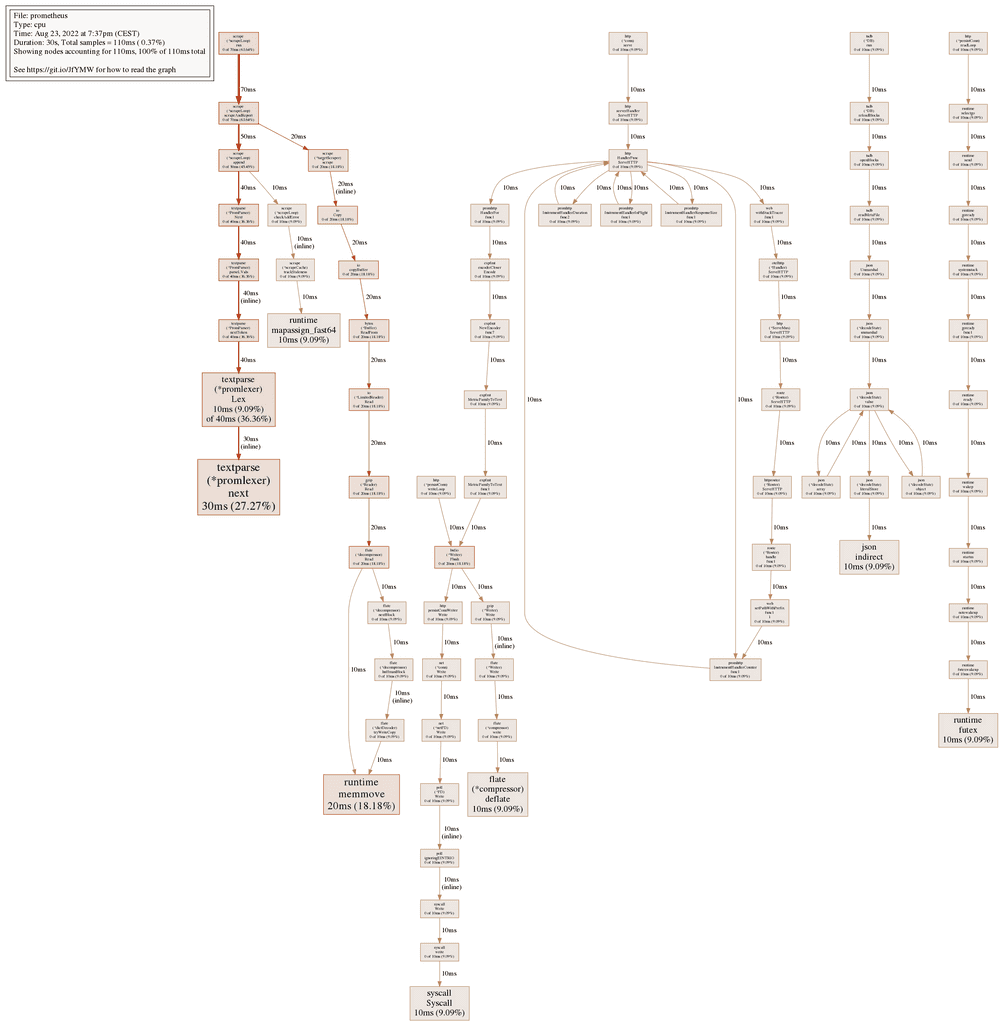
(pprof)Similarly to analyzing heap memory allocations, you can open a call graph visualization in the web browser again, this time annotated with both the flat and cumulative CPU usage amounts for each function:
You can see the top 10 CPU users using the top command:
(pprof) top
Showing nodes accounting for 110ms, 100% of 110ms total
Showing top 10 nodes out of 78
      flat  flat%   sum%        cum   cum%
      30ms 27.27% 27.27%       30ms 27.27%  github.com/prometheus/prometheus/model/textparse.(*promlexer).next (inline)
      20ms 18.18% 45.45%       20ms 18.18%  runtime.memmove
      10ms  9.09% 54.55%       10ms  9.09%  compress/flate.(*compressor).deflate
      10ms  9.09% 63.64%       10ms  9.09%  encoding/json.indirect
      10ms  9.09% 72.73%       40ms 36.36%  github.com/prometheus/prometheus/model/textparse.(*promlexer).Lex
      10ms  9.09% 81.82%       10ms  9.09%  runtime.futex
      10ms  9.09% 90.91%       10ms  9.09%  runtime.mapassign_fast64
      10ms  9.09%   100%       10ms  9.09%  syscall.Syscall
         0     0%   100%       20ms 18.18%  bufio.(*Writer).Flush
         0     0%   100%       20ms 18.18%  bytes.(*Buffer).ReadFrom
The columns here are interpreted in the same way as for heap allocations as well, and you can sort by the cumulative CPU usage by adding the -cum flag once again:
(pprof) top -cum
Showing nodes accounting for 40ms, 36.36% of 110ms total
Showing top 10 nodes out of 78
      flat  flat%   sum%        cum   cum%
         0     0%     0%       70ms 63.64%  github.com/prometheus/prometheus/scrape.(*scrapeLoop).run
         0     0%     0%       70ms 63.64%  github.com/prometheus/prometheus/scrape.(*scrapeLoop).scrapeAndReport
         0     0%     0%       50ms 45.45%  github.com/prometheus/prometheus/scrape.(*scrapeLoop).append
         0     0%     0%       40ms 36.36%  github.com/prometheus/prometheus/model/textparse.(*PromParser).Next
         0     0%     0%       40ms 36.36%  github.com/prometheus/prometheus/model/textparse.(*PromParser).nextToken (inline)
         0     0%     0%       40ms 36.36%  github.com/prometheus/prometheus/model/textparse.(*PromParser).parseLVals
      10ms  9.09%  9.09%       40ms 36.36%  github.com/prometheus/prometheus/model/textparse.(*promlexer).Lex
      30ms 27.27% 36.36%       30ms 27.27%  github.com/prometheus/prometheus/model/textparse.(*promlexer).next (inline)
         0     0% 36.36%       20ms 18.18%  bufio.(*Writer).Flush
         0     0% 36.36%       20ms 18.18%  bytes.(*Buffer).ReadFrom
These statistics can greatly help you figure out which portions of the code are using up the most amount of CPU time, which you could use to optimize parts of the codebase or track down buggy behaviors.