Profiling Heap Memory Usage
Prometheus' heap memory profiling endpoint is available at /debug/pprof/heap. While you can view this endpoint in the browser, the contents are easier to interpret by using the Go command-line tool to fetch and visualize the memory usage.
For a Prometheus server running on localhost, you could fetch a heap memory profile like this:
go tool pprof http://localhost:9090/debug/pprof/heapAfter fetching the profile, the tool drops you into a special shell that allow you to analyze the collected data in different ways:
Fetching profile over HTTP from http://localhost:9090/debug/pprof/heap
Saved profile in /home/julius/pprof/pprof.prometheus.alloc_objects.alloc_space.inuse_objects.inuse_space.001.pb.gz
File: prometheus
Type: inuse_space
Time: Aug 23, 2022 at 3:17pm (CEST)
Entering interactive mode (type "help" for commands, "o" for options)
(pprof)
You can type help to get a list of possible commands for analyzing the collected data.
For example, you could use the web command to open a browser window displaying a visual call graph that shows you how much of the currently allocated heap memory was allocated by different functions and their called sub-functions:
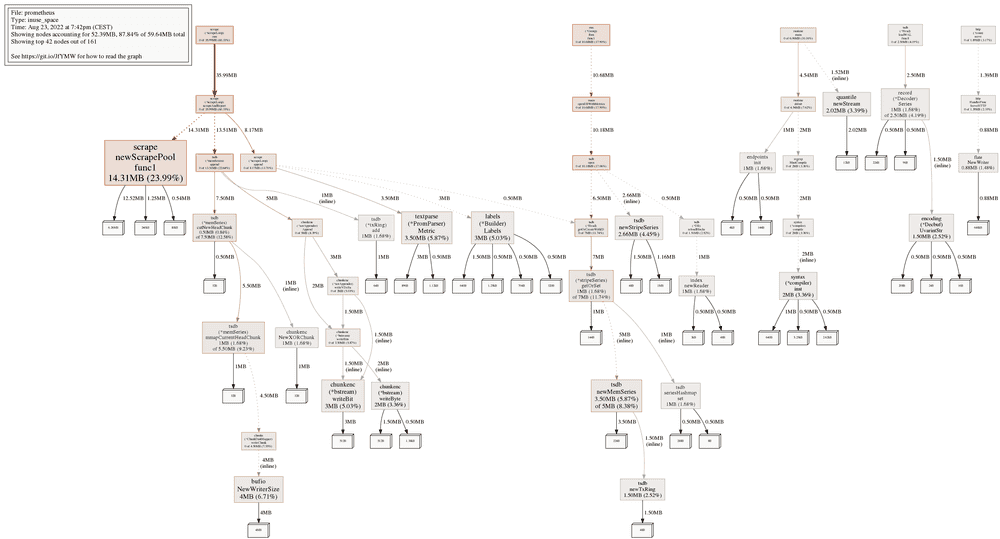
Each box represents one function or method, and the larger the box, the more memory has been allocated within that function. You can also see the exact absolute and percentage numbers for memory allocations for each displayed function. This can help you track down major sources of memory consumption, as well as memory leaks (if certain parts of the graph just keep growing non-stop over time).
See also the Google pprof documentation to learn more about interpreting this kind of graph.
As another example, the top command gives you a quick textual overview of the top memory consumers:
(pprof) top
Showing nodes accounting for 40MB, 67.07% of 59.64MB total
Showing top 10 nodes out of 161
      flat  flat%   sum%        cum   cum%
   14.31MB 23.99% 23.99%    14.31MB 23.99%  github.com/prometheus/prometheus/scrape.newScrapePool.func1
       4MB  6.71% 30.70%        4MB  6.71%  bufio.NewWriterSize
    3.50MB  5.87% 36.57%     3.50MB  5.87%  github.com/prometheus/prometheus/model/textparse.(*PromParser).Metric
    3.50MB  5.87% 42.44%        5MB  8.38%  github.com/prometheus/prometheus/tsdb.newMemSeries
       3MB  5.03% 47.47%        3MB  5.03%  github.com/prometheus/prometheus/model/labels.(*Builder).Labels
       3MB  5.03% 52.51%        3MB  5.03%  github.com/prometheus/prometheus/tsdb/chunkenc.(*bstream).writeBit
    2.66MB  4.45% 56.96%     2.66MB  4.45%  github.com/prometheus/prometheus/tsdb.newStripeSeries
    2.02MB  3.39% 60.35%     2.02MB  3.39%  github.com/beorn7/perks/quantile.newStream
       2MB  3.36% 63.71%        2MB  3.36%  regexp/syntax.(*compiler).inst
       2MB  3.36% 67.07%        2MB  3.36%  github.com/prometheus/prometheus/tsdb/chunkenc.(*bstream).writeByte
The columns mean the following here:
flat/flat%: The total amount and the percentage of memory allocated directly by the function itself (excluding called child functions).sum%: The sum of the flat percentage usages of the previous lines of the output. In the example above, this means that the top 10 functions account for a total of 67.07% of all allocations.cum/cum%: The cumulative total amount and the percentage of memory allocated by both the function itself and any called child functions.
To sort by cumulative memory allocations, add the -cum flag to top10:
(pprof) top -cum
Showing nodes accounting for 14.31MB, 23.99% of 59.64MB total
Showing top 10 nodes out of 161
      flat  flat%   sum%        cum   cum%
         0     0%     0%    35.99MB 60.33%  github.com/prometheus/prometheus/scrape.(*scrapeLoop).run
         0     0%     0%    35.99MB 60.33%  github.com/prometheus/prometheus/scrape.(*scrapeLoop).scrapeAndReport
   14.31MB 23.99% 23.99%    14.31MB 23.99%  github.com/prometheus/prometheus/scrape.newScrapePool.func1
         0     0% 23.99%    14.31MB 23.99%  github.com/prometheus/prometheus/util/pool.(*Pool).Get
         0     0% 23.99%    13.51MB 22.64%  github.com/prometheus/prometheus/scrape.(*scrapeLoop).scrapeAndReport.func1
         0     0% 23.99%    13.51MB 22.64%  github.com/prometheus/prometheus/storage.(*fanoutAppender).Commit
         0     0% 23.99%    13.51MB 22.64%  github.com/prometheus/prometheus/tsdb.(*headAppender).Commit
         0     0% 23.99%    13.51MB 22.64%  github.com/prometheus/prometheus/tsdb.(*memSeries).append
         0     0% 23.99%    13.51MB 22.64%  github.com/prometheus/prometheus/tsdb.dbAppender.Commit
         0     0% 23.99%    10.68MB 17.90%  github.com/oklog/run.(*Group).Run.func1
If you are interested in learning more about the usage of the pprof shell, see also the Profiling Go Programs blog post by the Go team.