Target Scrape Status
A frequent thing you want to ensure is that Prometheus scrapes all configured targets as expected and without any errors. The /targets page of the Prometheus server's web UI (reachable via the "Status" –> "Targets" menu item) shows you important scrape-related information for all active targets:
- The scrape endpoint URL,
- The current scrape health state:
UP: If the last scrape was successful,DOWN: If the last scrape was unsuccessful for any reason,UNKNOWN: If no scrape has occurred yet.
- The labels associated with the target,
- The last scrape time,
- The last scrape duration,
- The last scrape error, if any.
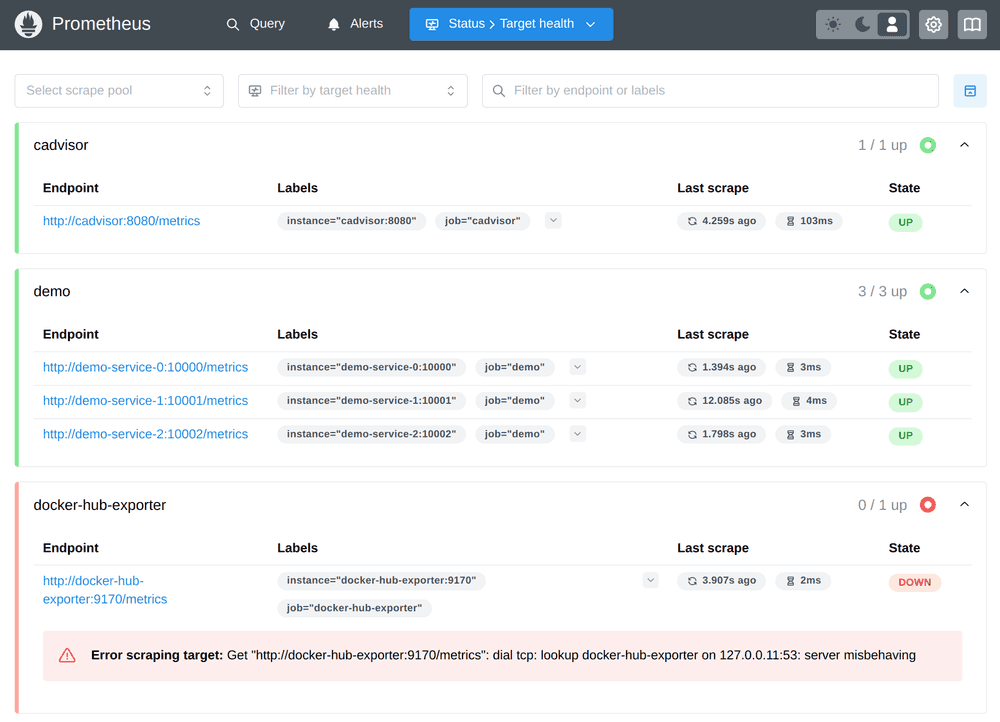
This page is a great first place to debug currently ongoing scrape issues, whether these are actually failing scrapes or completely missing targets. Especially the "Error" column is helpful in identifying the exact reason why a scrape is failing, since scrapes can fail for a variety reasons, for example:
- DNS resolution errors,
- Connection establishment errors,
- Connection timeouts / terminations,
- Metrics format errors.
For example, in the screenshot above, the single instance of the docker-hub-exporter job is currently in a DOWN state, with an error message indicating that there was a DNS lookup failure for this target.
Any scrape error will also cause Prometheus to set the up metric value for the corresponding target to 0, which you can use for basic health monitoring. Our Alerting with Prometheus training covers this in more detail.