TSDB Status Information
For larger Prometheus setups that collect a lot of metrics, you may start hitting scaling bottlenecks in Prometheus' on-disk time series database (TSDB). One of the main causes of high memory usage in a Prometheus server is that the total number of concurrently scraped time series is too large, since each series needs to be indexed in the TSDB's head block. The head block contains the last 2-3 hours of incoming metrics data, before that data is persisted to disk as a more optimized and immutable TSDB block.
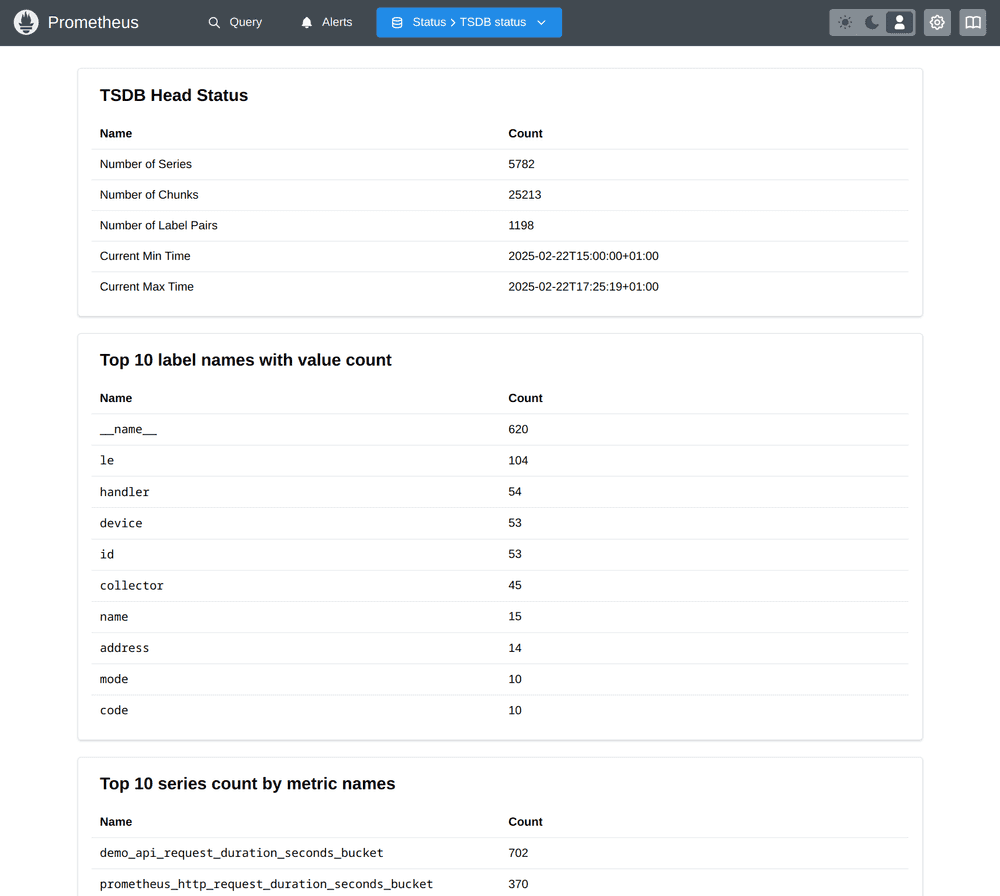
The /tsdb-status page (reachable via "Status" –> "TSDB Status") contains a wealth of statistical information about the TSDB's head block that helps you identify likely problems and culprits of high TSDB load:
Head block overview statistics
First, the page gives you overall statistics about the head block that help you get a high-level view of the health of the TSDB:
- Number of series: How many unique time series are currently present in the head block alone.
- Number of chunks: How many chunks these series occupy (each series is stored in one or more chunks, depending on its number of samples in the head block).
- Number of label pairs: How many unique key/value label combinations there are in the head block.
- Current min and max times: The current minimum and maximum sample timestamps in the head block.
Especially an unusually high number of time series and/or label pairs can point you to an unexpected explosion of label cardinality (too many distinct values in one or more labels that cause a series explosion).
Detailed head block cardinality statistics
Once you have identified a high number of time series as the cause of a scaling bottleneck, the TSDB status page also shows you more detailed statistical information about individual metric names and labels that let you hunt down likely culprits:
- Top 10 label names with value count: This table shows you the top 10 label names with the highest number of unique label values. Especially if some unintentional high-cardinality data (like public user IPs or full HTTP paths) are stored in label values, you will immediately see those problematic labels at the top here.
- Top 10 series count by metric names: This table shows you the top 10 metric names by the count of time series that are associated with them. Sometimes there is no single label that is problematic enough, but this can help you track down metric names that overall have a combination of labels attached to them that cause a large number of time series.
- Top 10 label names with high memory usage: This table shows you the top 10 label names with the highest memory usage. This can help you identify label names that may not have a too high number of values associated with them, but where individual values are overly large and memory-consuming.
- Top 10 series count by label value pairs: This table shows you the top 10 label name / value pairs that have the largest number of series associated with them. Sometimes you will find a specific label combination at the top here, like a histogram metric name (
__name__="my_histogram_bucket") that has a lot of bucket time series attached.
Overall, these statistics should be very helpful in tracking down cardinality-related issues in your TSDB usage.