Starting Prometheus
Start Prometheus with your newly created configuration file:
./prometheusIt should log a number of startup messages and then start serving on port 9090:
time=2026-03-04T14:59:03.164Z level=INFO source=main.go:1611 msg="updated GOGC" old=100 new=75
time=2026-03-04T14:59:03.164Z level=INFO source=main.go:723 msg="Leaving GOMAXPROCS=2: CPU quota undefined" component=automaxprocs
time=2026-03-04T14:59:03.164Z level=INFO source=memlimit.go:198 msg="GOMEMLIMIT is updated" component=automemlimit package=github.com/KimMachineGun/automemlimit/memlimit GOMEMLIMIT=7496489779 previous=9223372036854775807
time=2026-03-04T14:59:03.164Z level=INFO source=main.go:771 msg="No time or size retention was set so using the default time retention" duration=15d
time=2026-03-04T14:59:03.164Z level=INFO source=main.go:822 msg="Starting Prometheus Server" mode=server version="(version=3.10.0, branch=HEAD, revision=54e010926b0a270cadb22be1113ad45fe9bcb90a)"
time=2026-03-04T14:59:03.164Z level=INFO source=main.go:827 msg="operational information" build_context="(go=go1.26.0, platform=linux/amd64, user=root@2ee2be8e6652, date=20260225-21:12:02, tags=netgo,builtinassets)" host_details="(Linux 6.8.0-1044-azure #50~22.04.1-Ubuntu SMP Wed Dec  3 15:13:22 UTC 2025 x86_64 codespaces-339e0b (none))" fd_limits="(soft=524288, hard=524288)" vm_limits="(soft=unlimited, hard=unlimited)"
time=2026-03-04T14:59:03.343Z level=INFO source=web.go:696 msg="Start listening for connections" component=web address=0.0.0.0:9090
time=2026-03-04T14:59:03.343Z level=INFO source=main.go:1350 msg="Starting TSDB ..."
time=2026-03-04T14:59:03.345Z level=INFO source=tls_config.go:354 msg="Listening on" component=web address=[::]:9090
time=2026-03-04T14:59:03.345Z level=INFO source=tls_config.go:357 msg="TLS is disabled." component=web http2=false address=[::]:9090
time=2026-03-04T14:59:03.347Z level=INFO source=head.go:680 msg="Replaying on-disk memory mappable chunks if any" component=tsdb
time=2026-03-04T14:59:03.347Z level=INFO source=head.go:766 msg="On-disk memory mappable chunks replay completed" component=tsdb duration=2.156µs
time=2026-03-04T14:59:03.347Z level=INFO source=head.go:774 msg="Replaying WAL, this may take a while" component=tsdb
time=2026-03-04T14:59:03.347Z level=INFO source=head.go:847 msg="WAL segment loaded" component=tsdb segment=0 maxSegment=0 duration=175.514µs
time=2026-03-04T14:59:03.348Z level=INFO source=head.go:884 msg="WAL replay completed" component=tsdb checkpoint_replay_duration=34.556µs wal_replay_duration=733.339µs wbl_replay_duration=227ns chunk_snapshot_load_duration=0s mmap_chunk_replay_duration=2.156µs total_replay_duration=930.903µs
time=2026-03-04T14:59:03.351Z level=INFO source=main.go:1371 msg="filesystem information" fs_type=EXT4_SUPER_MAGIC
time=2026-03-04T14:59:03.351Z level=INFO source=main.go:1374 msg="TSDB started"
time=2026-03-04T14:59:03.351Z level=INFO source=main.go:1564 msg="Loading configuration file" filename=prometheus.yml
time=2026-03-04T14:59:03.351Z level=INFO source=main.go:1604 msg="Completed loading of configuration file" db_storage=1.317µs remote_storage=1.422µs web_handler=474ns query_engine=696ns scrape=166.372µs scrape_sd=21.452µs notify=1.103µs notify_sd=612ns rules=1.487µs tracing=6.099µs filename=prometheus.yml totalDuration=422.677µs
time=2026-03-04T14:59:03.351Z level=INFO source=main.go:1335 msg="Server is ready to receive web requests."
time=2026-03-04T14:59:03.351Z level=INFO source=manager.go:202 msg="Starting rule manager..." component="rule manager"
By default, Prometheus:
- Reads its configuration from the file
prometheus.yml. You can configure this using the--config.filecommand-line flag. - Stores its database in the
./datadirectory. You can configure this using the--storage.tsdb.pathcommand-line flag.
NOTE: Any settings configured in the configuration file are reloadable during runtime (by sending a
HUPsignal or by triggering a reload via the HTTP API), while any changes to flag-based settings require a full server restart to take effect.
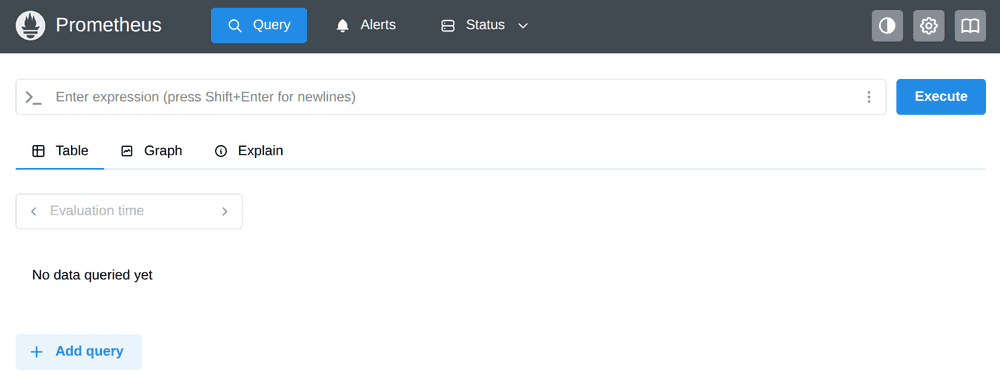
You should now be able to reach the Prometheus server's query page at http://<machine-ip>:9090/:
Give the server a couple of seconds to collect data about itself from its own HTTP metrics endpoint.
You can also verify that Prometheus is serving metrics about itself by navigating to its metrics endpoint: http://<machine-ip>:9090/metrics
This should show a long list of metrics looking something like this:
# HELP go_gc_cleanups_executed_cleanups_total Approximate total count of cleanup functions (created by runtime.AddCleanup) executed by the runtime. Subtract /gc/cleanups/queued:cleanups to approximate cleanup queue length. Useful for detecting slow cleanups holding up the queue. Sourced from /gc/cleanups/executed:cleanups.
# TYPE go_gc_cleanups_executed_cleanups_total counter
go_gc_cleanups_executed_cleanups_total 0
# HELP go_gc_cleanups_queued_cleanups_total Approximate total count of cleanup functions (created by runtime.AddCleanup) queued by the runtime for execution. Subtract from /gc/cleanups/executed:cleanups to approximate cleanup queue length. Useful for detecting slow cleanups holding up the queue. Sourced from /gc/cleanups/queued:cleanups.
# TYPE go_gc_cleanups_queued_cleanups_total counter
go_gc_cleanups_queued_cleanups_total 0
# HELP go_gc_cycles_automatic_gc_cycles_total Count of completed GC cycles generated by the Go runtime. Sourced from /gc/cycles/automatic:gc-cycles.
# TYPE go_gc_cycles_automatic_gc_cycles_total counter
go_gc_cycles_automatic_gc_cycles_total 21
# HELP go_gc_cycles_forced_gc_cycles_total Count of completed GC cycles forced by the application. Sourced from /gc/cycles/forced:gc-cycles.
# TYPE go_gc_cycles_forced_gc_cycles_total counter
go_gc_cycles_forced_gc_cycles_total 0
# HELP go_gc_cycles_total_gc_cycles_total Count of all completed GC cycles. Sourced from /gc/cycles/total:gc-cycles.
# TYPE go_gc_cycles_total_gc_cycles_total counter
go_gc_cycles_total_gc_cycles_total 21
# HELP go_gc_duration_seconds A summary of the wall-time pause (stop-the-world) duration in garbage collection cycles.
# TYPE go_gc_duration_seconds summary
go_gc_duration_seconds{quantile="0"} 2.3594e-05
go_gc_duration_seconds{quantile="0.25"} 4.3831e-05
go_gc_duration_seconds{quantile="0.5"} 5.3728e-05
go_gc_duration_seconds{quantile="0.75"} 9.7017e-05
go_gc_duration_seconds{quantile="1"} 0.002474037
go_gc_duration_seconds_sum 0.006489857
go_gc_duration_seconds_count 21
# HELP go_gc_finalizers_executed_finalizers_total Total count of finalizer functions (created by runtime.SetFinalizer) executed by the runtime. Subtract /gc/finalizers/queued:finalizers to approximate finalizer queue length. Useful for detecting finalizers overwhelming the queue, either by being too slow, or by there being too many of them. Sourced from /gc/finalizers/executed:finalizers.
# TYPE go_gc_finalizers_executed_finalizers_total counter
go_gc_finalizers_executed_finalizers_total 0
# HELP go_gc_finalizers_queued_finalizers_total Total count of finalizer functions (created by runtime.SetFinalizer) and queued by the runtime for execution. Subtract from /gc/finalizers/executed:finalizers to approximate finalizer queue length. Useful for detecting slow finalizers holding up the queue. Sourced from /gc/finalizers/queued:finalizers.
# TYPE go_gc_finalizers_queued_finalizers_total counter
go_gc_finalizers_queued_finalizers_total 0
# HELP go_gc_gogc_percent Heap size target percentage configured by the user, otherwise 100. This value is set by the GOGC environment variable, and the runtime/debug.SetGCPercent function. Sourced from /gc/gogc:percent.
# TYPE go_gc_gogc_percent gauge
go_gc_gogc_percent 75
# HELP go_gc_gomemlimit_bytes Go runtime memory limit configured by the user, otherwise math.MaxInt64. This value is set by the GOMEMLIMIT environment variable, and the runtime/debug.SetMemoryLimit function. Sourced from /gc/gomemlimit:bytes.
# TYPE go_gc_gomemlimit_bytes gauge
go_gc_gomemlimit_bytes 7.496489779e+09

# [...more...]