Using the Query Page
The Query page is Prometheus' built-in interface for running PromQL queries. You can view it at http://<machine-ip>:9090/:
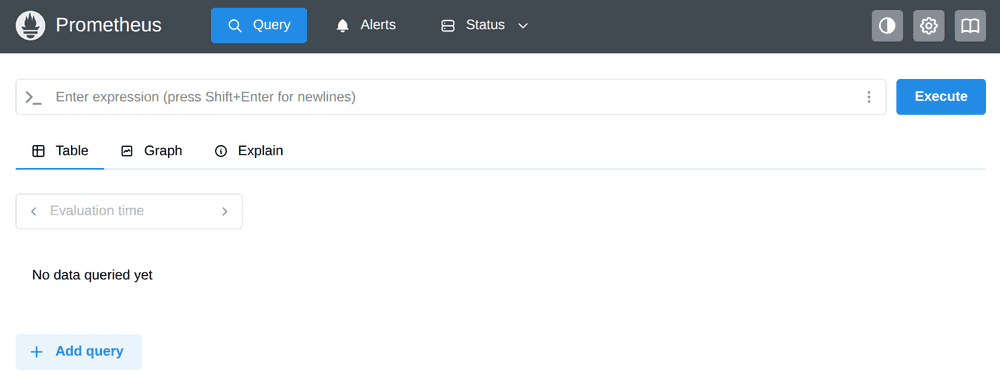
The Table, Graph, and Explain views
The Table view shows the most recent value of each output series of an expression, while the Graph view plots values over time. Graphing queries can be more expensive for both the server and the client (browser), since it queries and displays more data. So it is generally a good idea to try potentially expensive expressions in the Table view first and switch to the Graph view once you have sufficiently narrowed down the results of an expression.
Since Prometheus 3.0, there is also a new Explain view which can help explain and visualize the behaviors of individual parts of a PromQL expression by selecting them in a syntax tree view above the pane.
Query examples
Without diving too deeply into PromQL, here are some example queries you can try on the Query page.
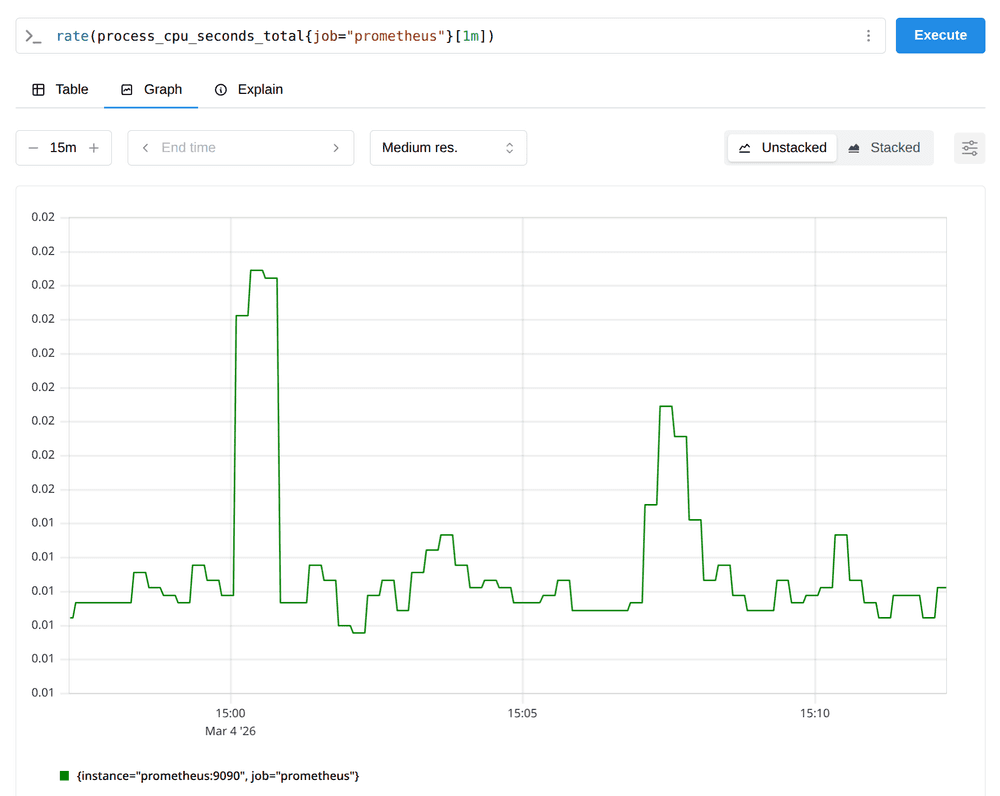
This expression tells you Prometheus' own CPU usage in cores, as averaged over a 1-minute window:
rate(process_cpu_seconds_total{job="prometheus"}[1m])Graphing the result should look something like this:
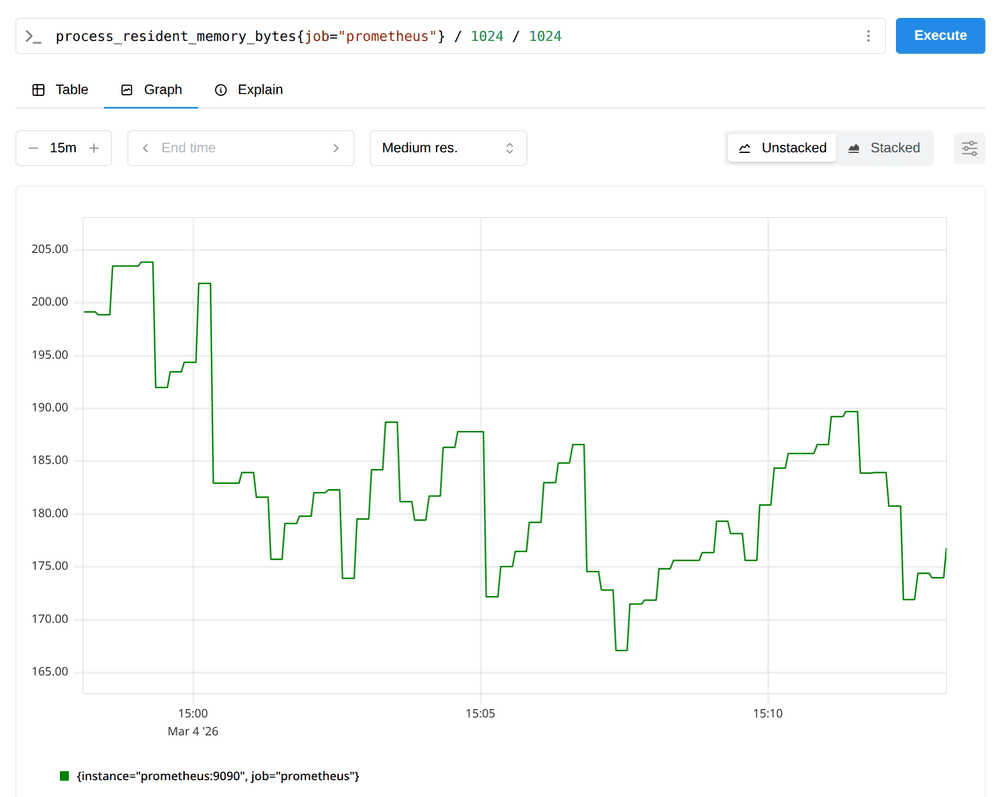
This expression tells you Prometheus' own resident memory usage in mebibytes (MiB):
process_resident_memory_bytes{job="prometheus"} / 1024 / 1024Graphing the result should look something like this:
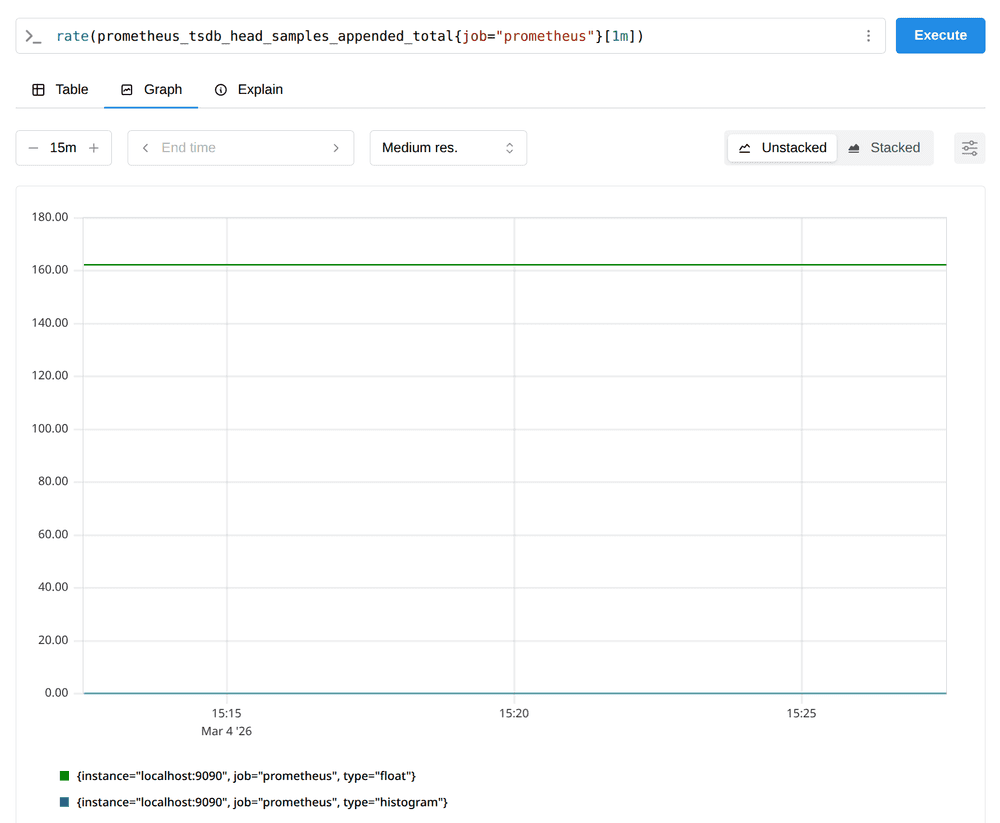
This expression shows you the number of samples per second that Prometheus is currently storing, as averaged over a 1-minute window:
rate(prometheus_tsdb_head_samples_appended_total{job="prometheus"}[1m])Graphing the result should look something like this:
This shows the value of the synthetic up metric that Prometheus records for every target scrape, in this case, scoped to just the prometheus job:
up{job="prometheus"}Looking at this metric in the Table view should look like this:
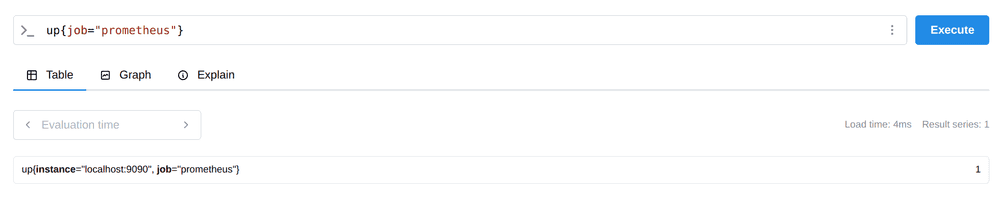
The value for this metric is set to 0 whenever a scrape fails and to 1 when it succeeds.
Try viewing all expressions in the Table view as well as the Graph view.