Viewing Monitored Targets
When setting up a new Prometheus server, one of the first things you will want to check is whether it is scraping its targets correctly.
Navigate to http://<machine-ip>:9090/targets to view a list of all targets, grouped by their scrape configuration in the Prometheus server configuration file:
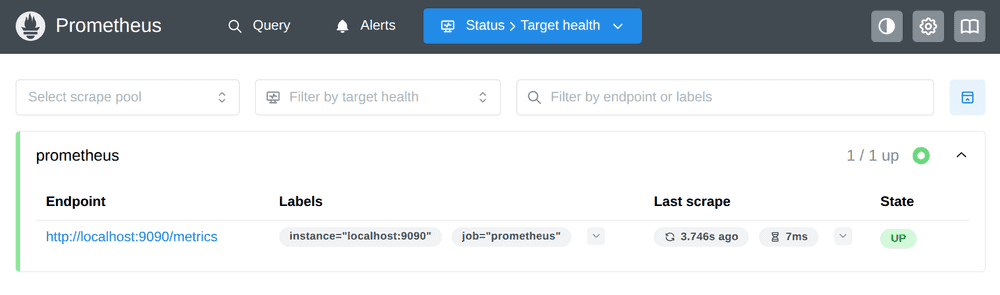
In this case, Prometheus is only scraping itself, so you will see only one scrape pool with a single target. The one target endpoint for the prometheus scrape pool should show a green UP state indicator. This means that Prometheus was able to scrape this endpoint successfully.
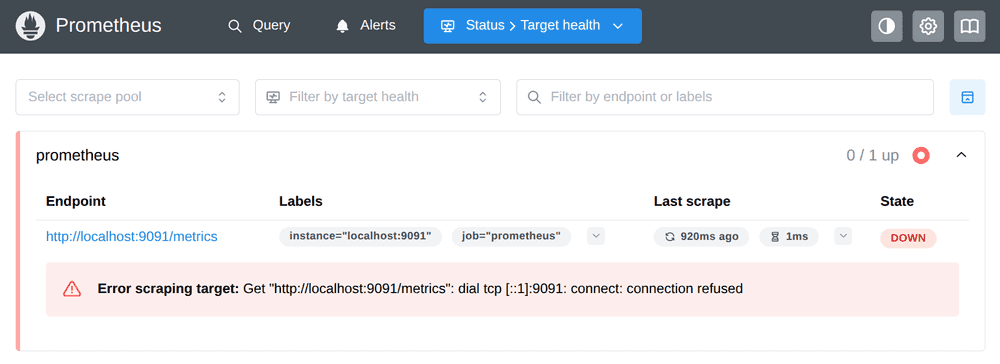
In case anything goes wrong during a scrape (whether the problem is a DNS resolution failure, a connection timeout, a bad metrics payload format, or any other reason), the target state will be shown as DOWN, along with an error message providing more detail about the scrape failure. This is helpful for quickly spotting misconfigurations or finding unhealthy targets.
For example, if you had configured Prometheus to scrape itself on an incorrect port (9091 instead of 9090), the targets page would indicate a connection refused error: