What is Prometheus?
Prometheus is a metrics-based monitoring and alerting stack.
Prometheus provides libraries and server components to provide a full monitoring pipeline:
- Tracking and exposing metrics (instrumentation),
- Collecting metrics,
- Storing metrics,
- Querying metrics for alerting, dashboarding, and more.

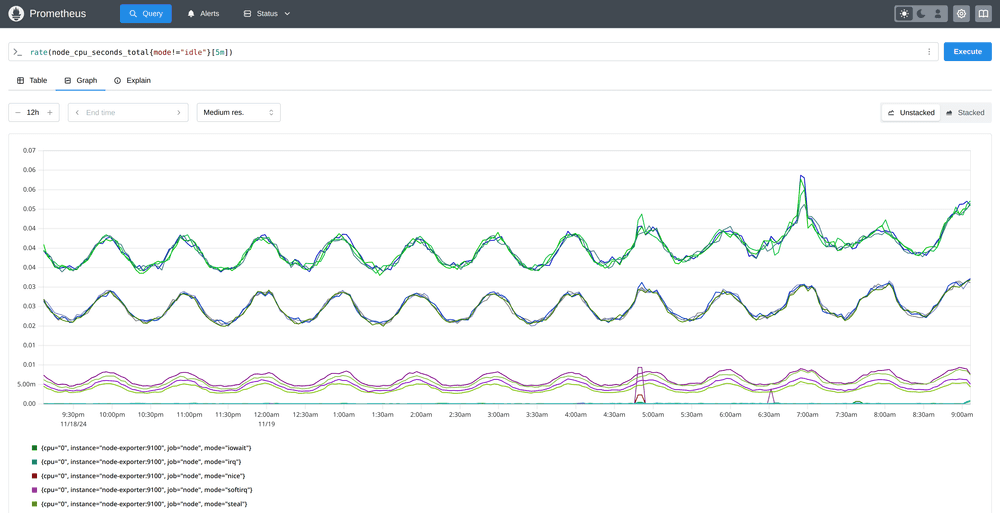
Here's what the Prometheus server's querying and graphing UI looks like:
Prometheus is generic enough to monitor all levels of your stack: your own application software, third-party services, hosts, networking devices, or anything else that can expose Prometheus-compatible metrics. Some people even use Prometheus to monitor wind power farms or digital train station displays.
Due to its integration with service discovery mechanisms, Prometheus works especially well for monitoring dynamic cloud environments and cluster schedulers such as Kubernetes.