Using the Expression Browser
The expression browser is Prometheus' built-in interface for running PromQL queries. To use the expression browser, navigate to http://<machine-ip>:9090/ and choose the "Table" view. It should look like this:
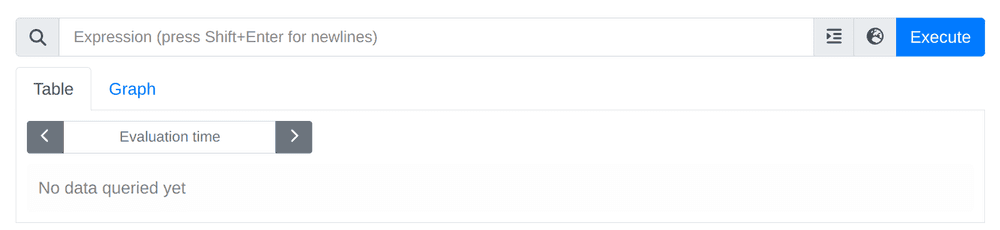
The "Table" tab shows the most recent value of each output series of an expression, while the "Graph" tab plots values over time. The latter can be expensive (for both the server and the browser). It is in general a good idea to try potentially expensive expressions in the "Table" tab first and switch to the "Graph" tab once you have sufficiently narrowed down the results of an expression. Take a bit of time to play with the expression browser.
Suggestions for expressions:
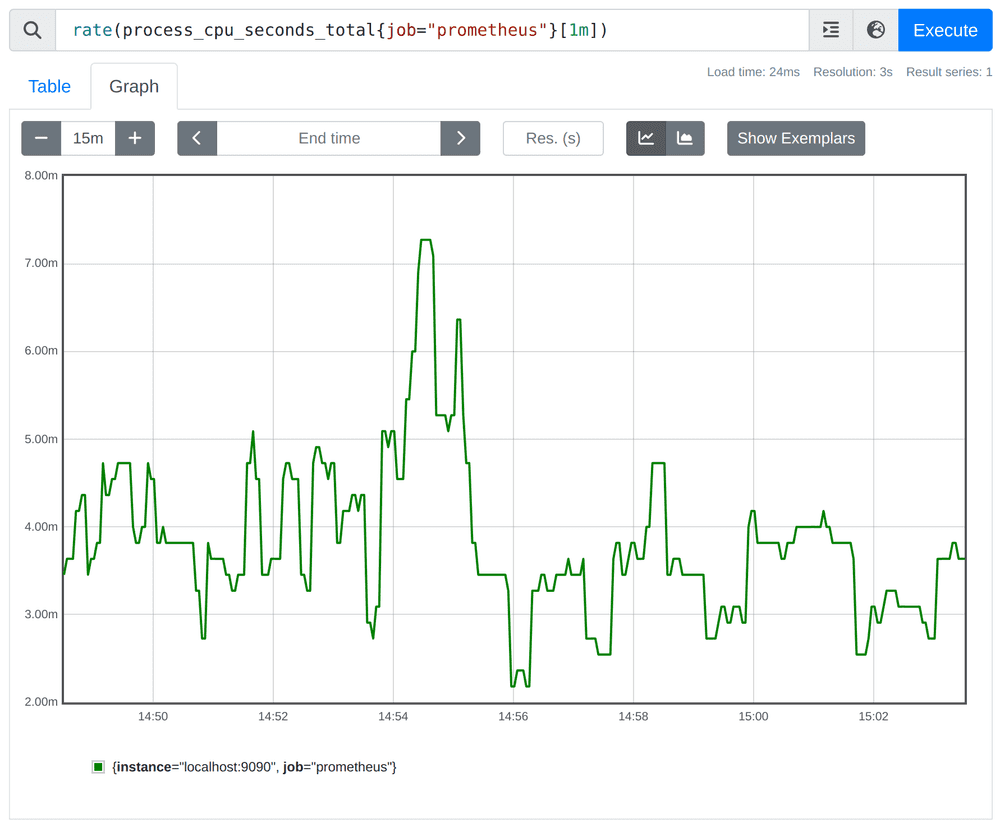
This expression tells you Prometheus' own CPU usage in cores, as averaged over a 1-minute window:
rate(process_cpu_seconds_total{job="prometheus"}[1m])Graphing the result should look something like this:
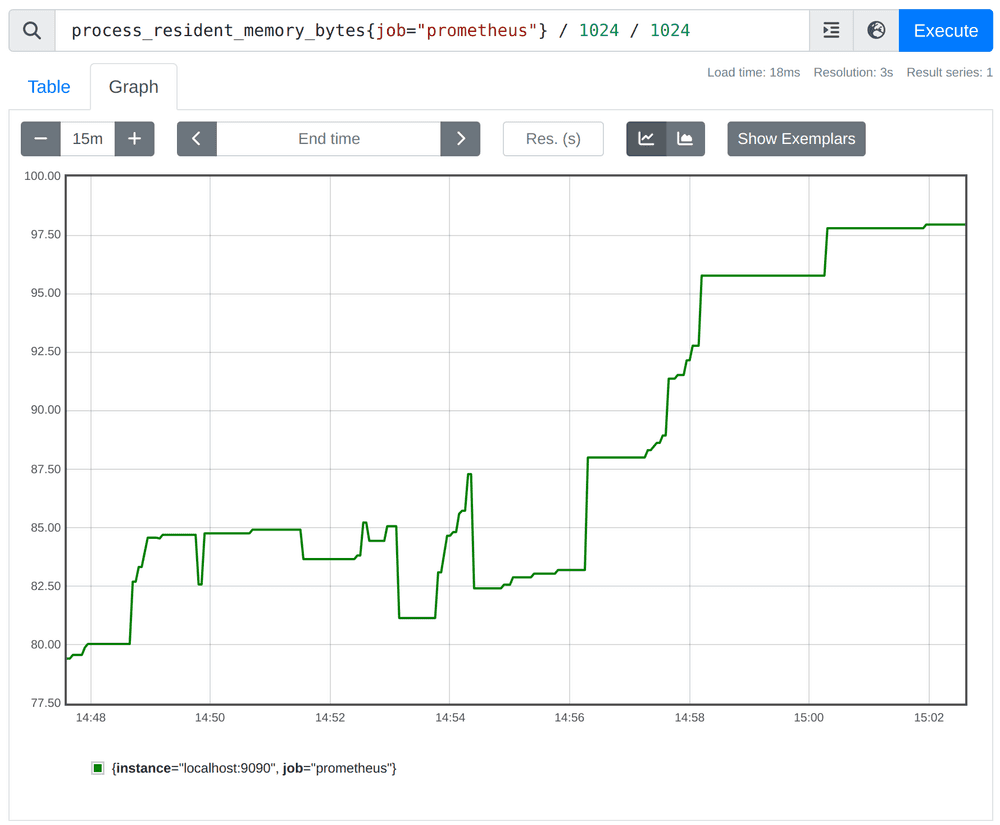
This expression tells you Prometheus' own resident memory usage in mebibytes (MiB):
process_resident_memory_bytes{job="prometheus"} / 1024 / 1024Graphing the result should look something like this:
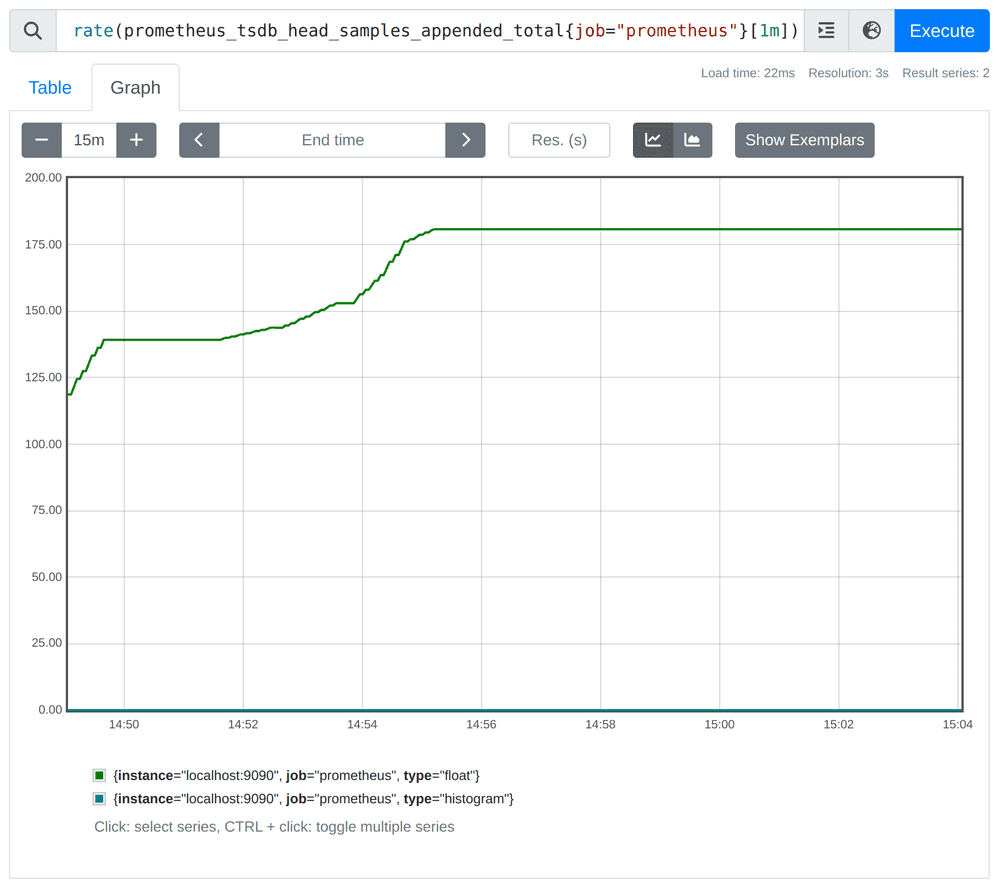
This expression shows you the number of samples per second that Prometheus is currently storing, as averaged over a 1-minute window:
rate(prometheus_tsdb_head_samples_appended_total{job="prometheus"}[1m])Graphing the result should look something like this:
This shows the value of the synthetic up metric that Prometheus records for every target scrape, in this case, scoped to just the prometheus job:
up{job="prometheus"}Looking at this metric in the "Table" view should look like this:
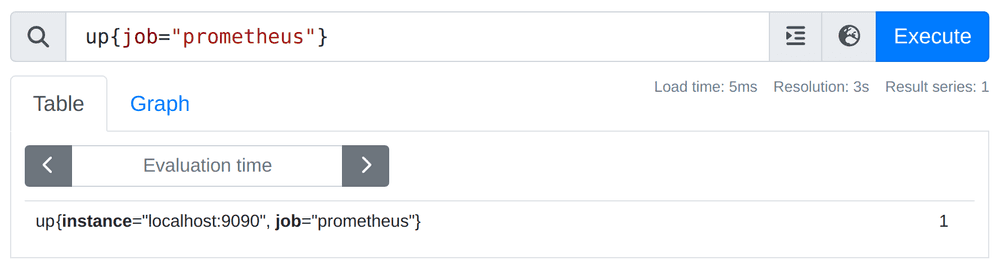
The value for this metric is set to 0 whenever a scrape fails and to 1 when it succeeds.
Try viewing all expressions in the "Table" view as well as the "Graph" view.